Atmena is an indoor environment quality sensing and analysis system built by Nathan Woltman, Andrew Gillies, Aayush Rajasekaran, and myself for the SE 491 UW capstone course in June 2016. The project idea was to test newly available cheap environmental sensors and connect the good ones to a microcontroller with WLAN, then send the measurements to our web server for processing, storage, and analytics. We could then use the information to benchmark and communicate how to improve indoor environments as a service. This is a retrospective write up of the project: hardware, firmware, and web service.
Hardware
There was a relatively step learning curve to testing and integrating all the cheap environmental sensors. For application in health and comfort in typical buildings We wanted to provide a relatively complete environmental sensing suite including:
- Temperature
- Humidity
- Air flow
- Barometric pressure
- Sound
- Light
- Carbon dioxide (CO2)
- Carbon monoxide (CO)
- Oxygen (O2)
- Volatile Organic Compounds (VOC)
- Particulate Matter (PM)
- Ozone (O3)
- Nitrogen oxide (NOx)
- Gas leak (CH4 and LPG)
This meant we ended up having to order and test a lot of sensors. The integration of each sensor to our hacky testing board was quite laborious given the sensors had different output types, voltages, and power requirements. With a multimeter, soldering iron, helping hand, and a few late nights we got through it. You can see the detailed specs of all the sensors we tested in the test hardware spec sheet. Thankfully the UW Software Engineering department generously reimbursed us for the cost of the electronics.
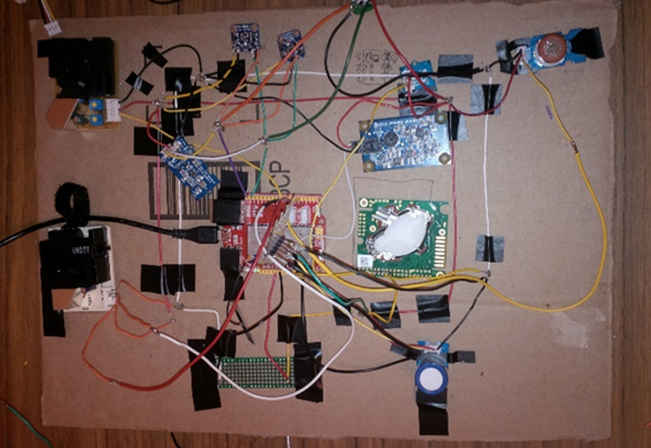
Despite looking like garbage our testing allowed us to whittle our list of sensors down to the ones that actually worked and provided more benefit than headache. Ya, the cheap fire-hazard O2 and CO sensors didn’t make the cut (drawing ~1A they got surprisingly hot!). The following list shows the specific sensors we greenlit for use in our prototype design.
| Parameter | Sensor Name |
|---|---|
| Temperature/humidity | Adafruit HTU21D |
| Air flow | Wind Sensor Rev. C |
| Barometric pressure | Adafruit BMP180 |
| Sound | Phidgets Sound Sensor |
| Luminosity | Adafruit TSL2561 |
| Carbon dioxide | K30 10,000ppm |
| Carbon monoxide and NOx | MiCS-6814 |
| Volatile organic compounds | MiCS-VZ-86/89 |
| Particulate Matter | Sharp GP2Y1010AU0F |
| Ozone | MICS-2614 |
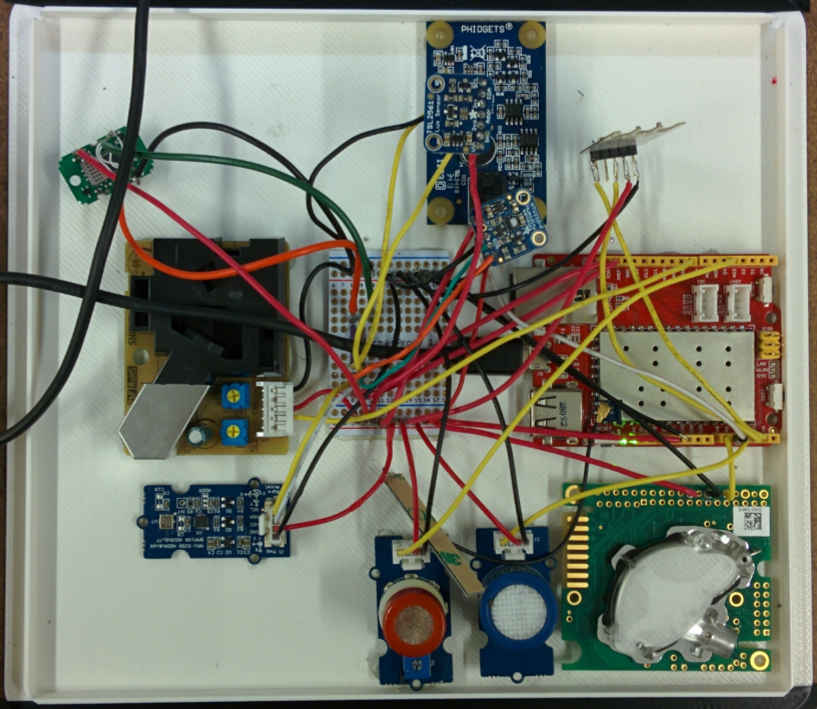
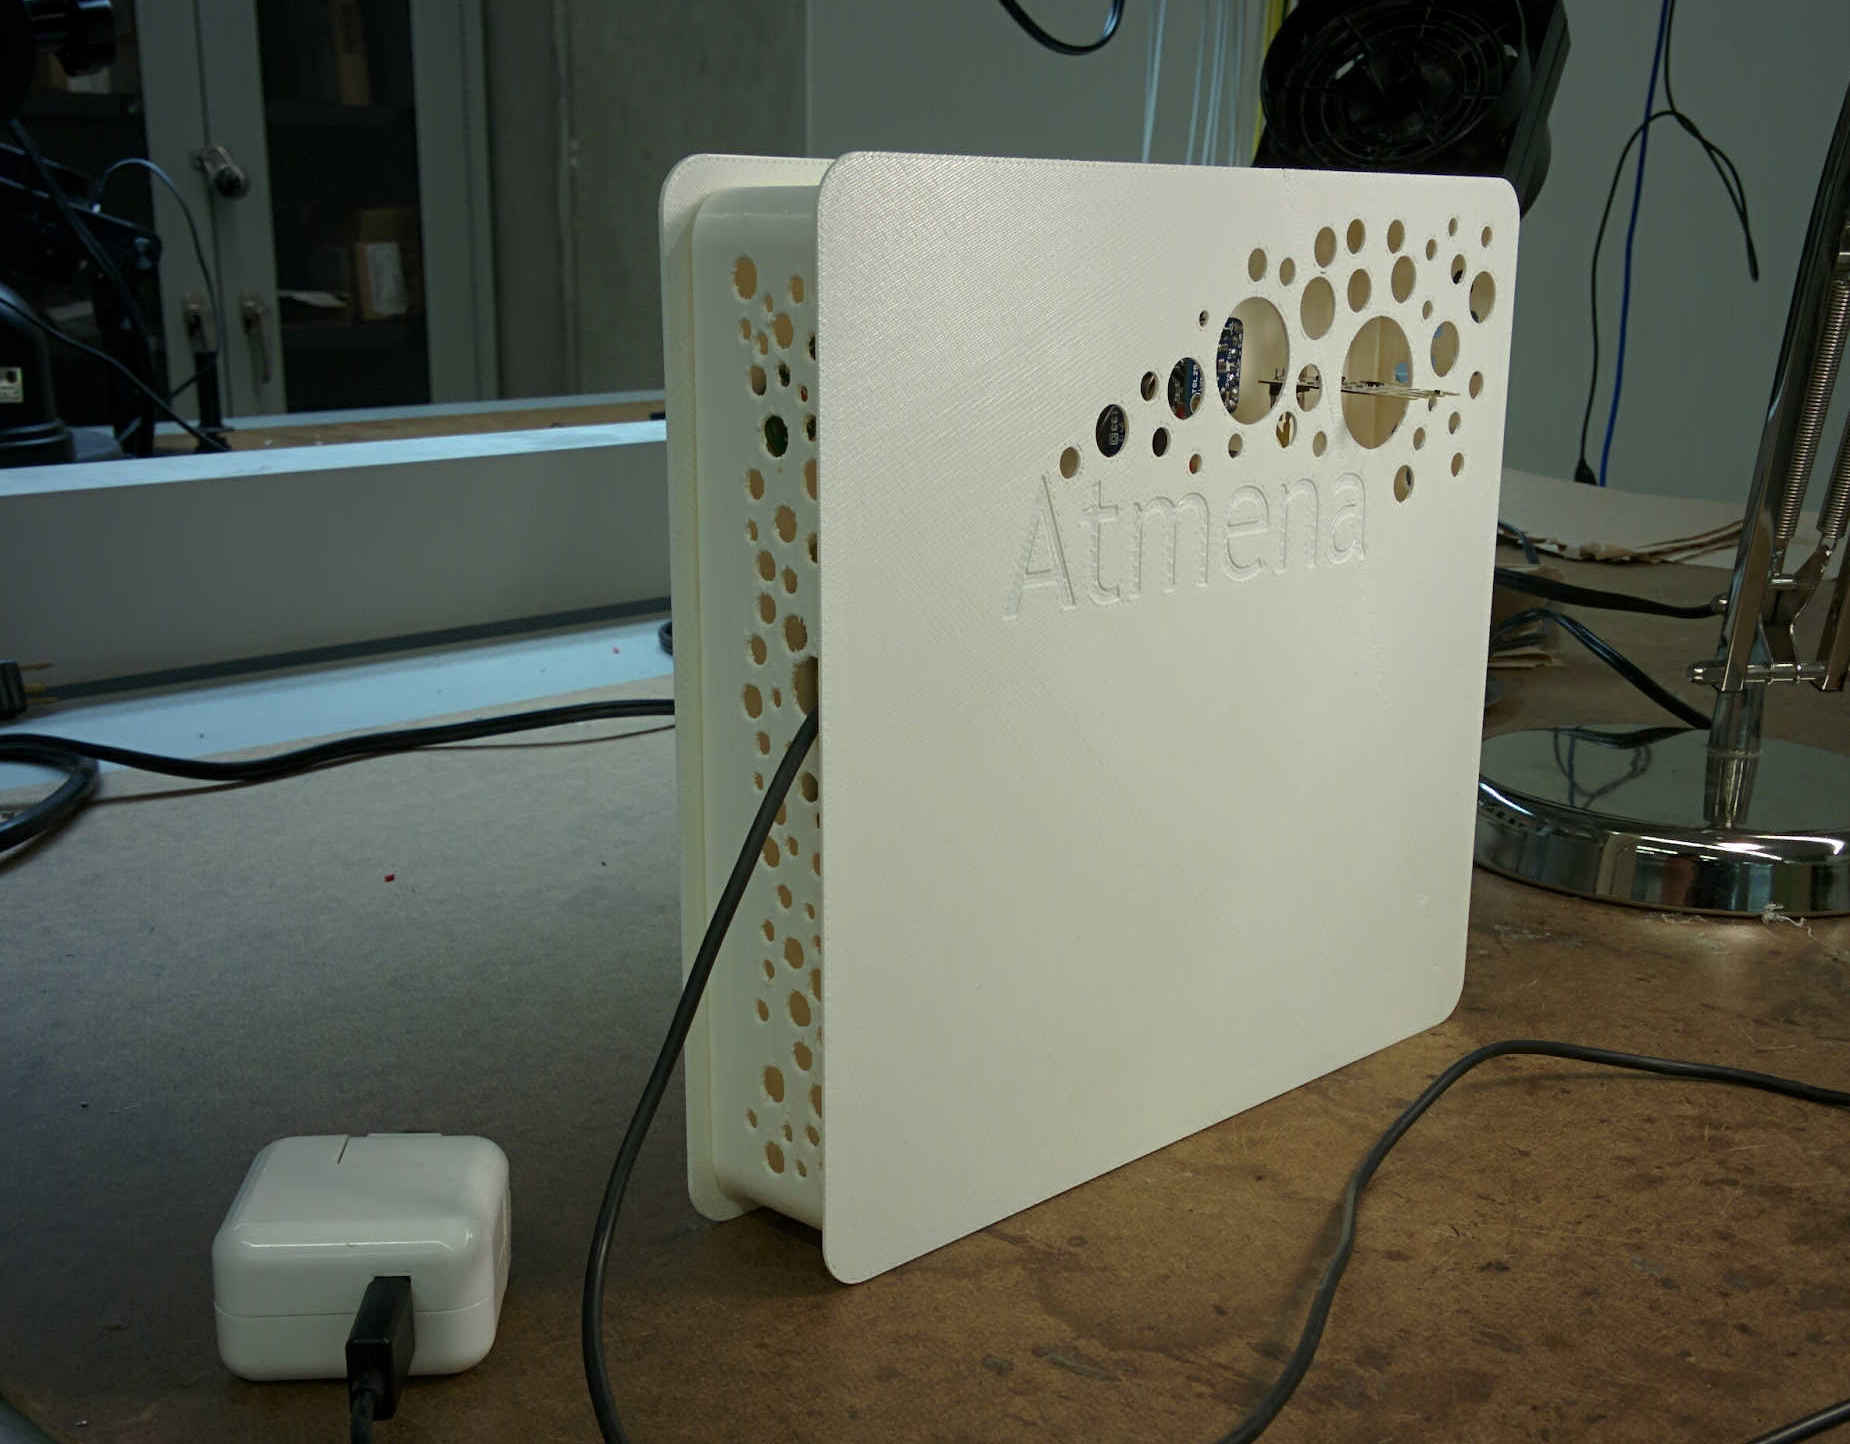
Our design is shown below and with the cost for all components around $660 CAD including shipping. You can see the full cost breakdown in this hardware budget sheet.
We did a quick case design in SolidWorks and got it printed at the UW 3D print shop. We put in some perforations to let in light, air, and a wall-wart power cord.
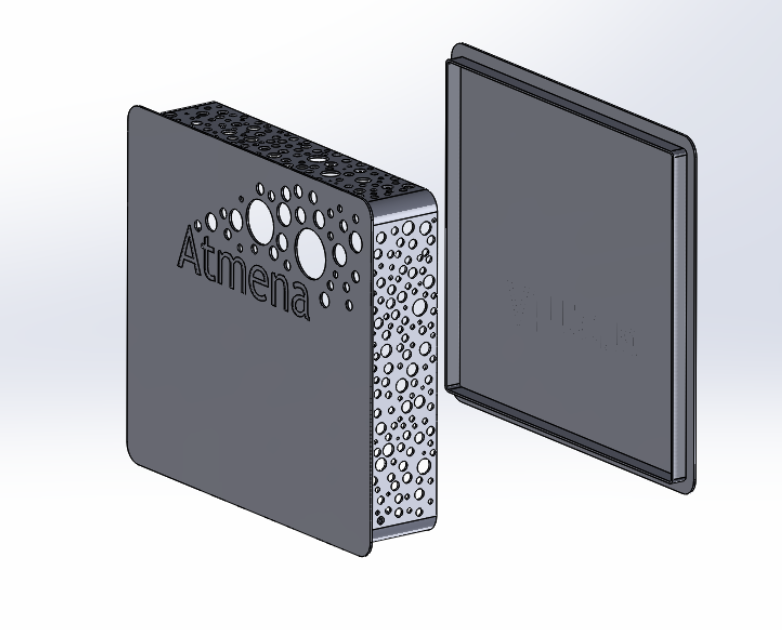
Here is what our prototype looked like.
Firmware
We built the firmware on the Arduino prototyping platform which uses AVR C/C++ (avr-g++). Using the Arduino IDE is pretty straight forward. We chose to open source the code under the Apache 2.0 license so you can checkout firmware code in the firmware repo.
Data API
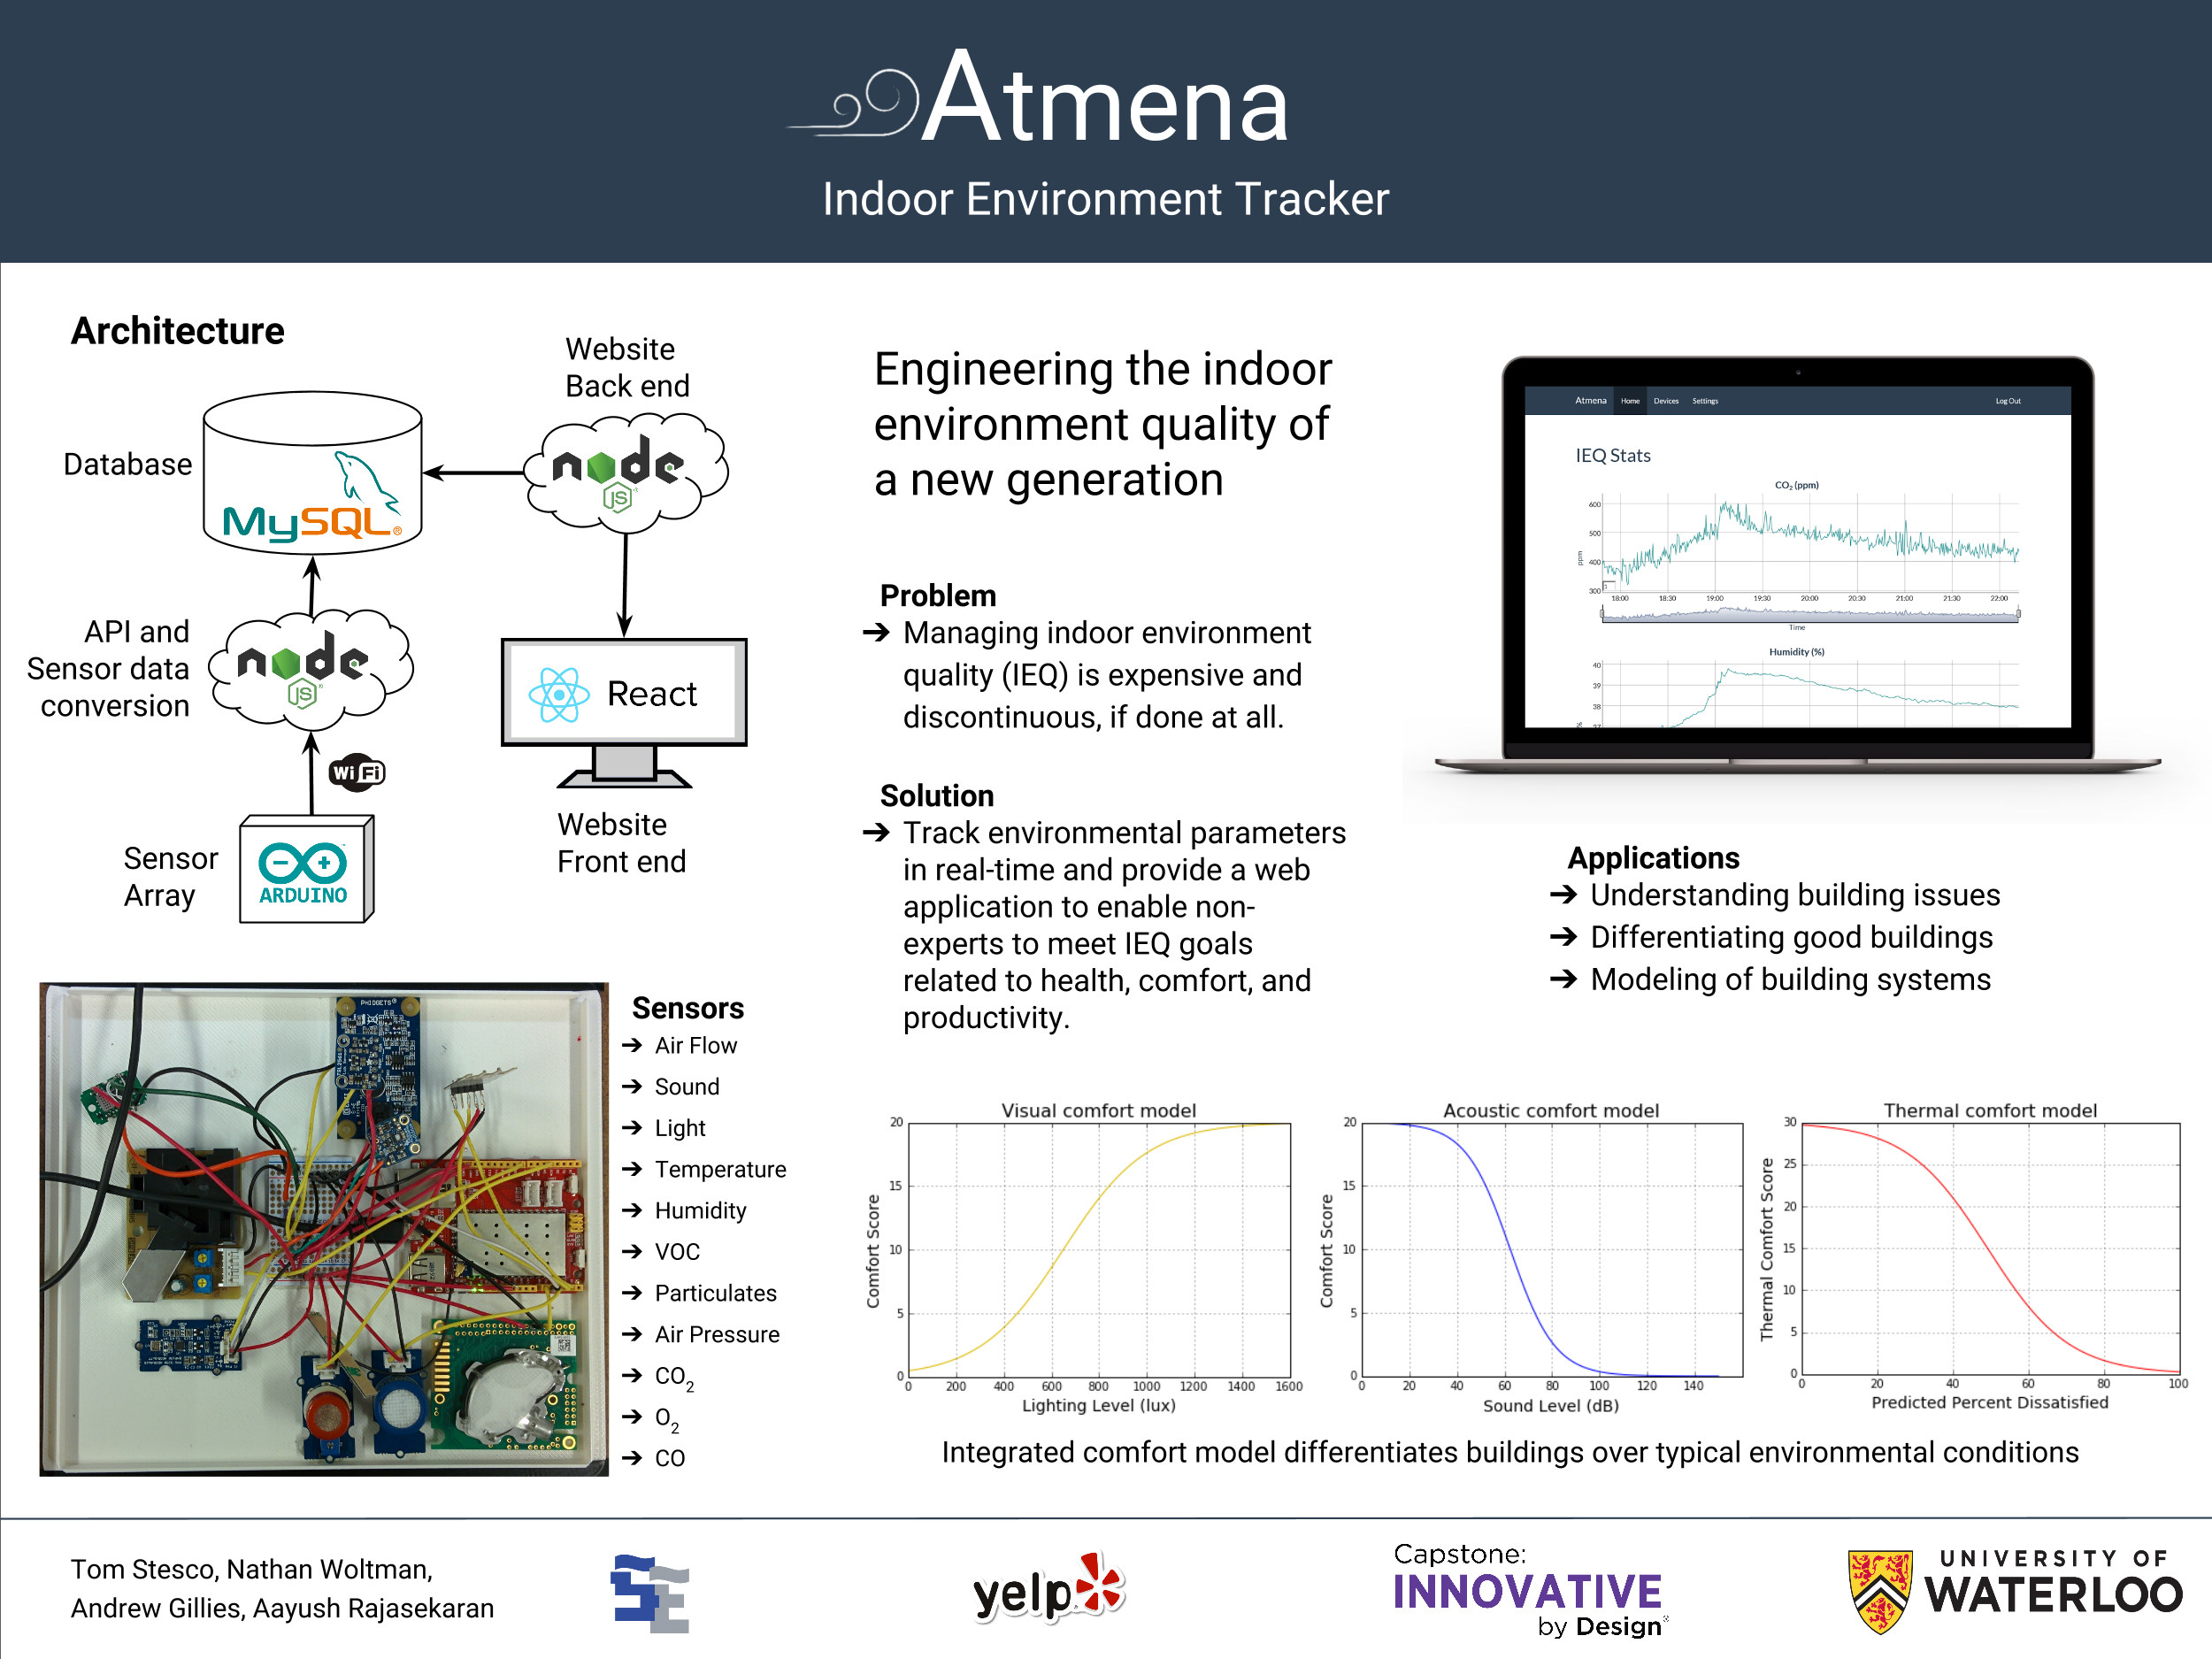
Of course no analytics system is complete without a web micro-service to do data magic with all those sensor payloads hitting the server. We built our API using node.js, MySQL, and socket.io. An interesting design decision we made was doing all the raw data conversion to unit values on the server to make rolling updates and calibration more seamless. Checkout the API code in the data api repo.
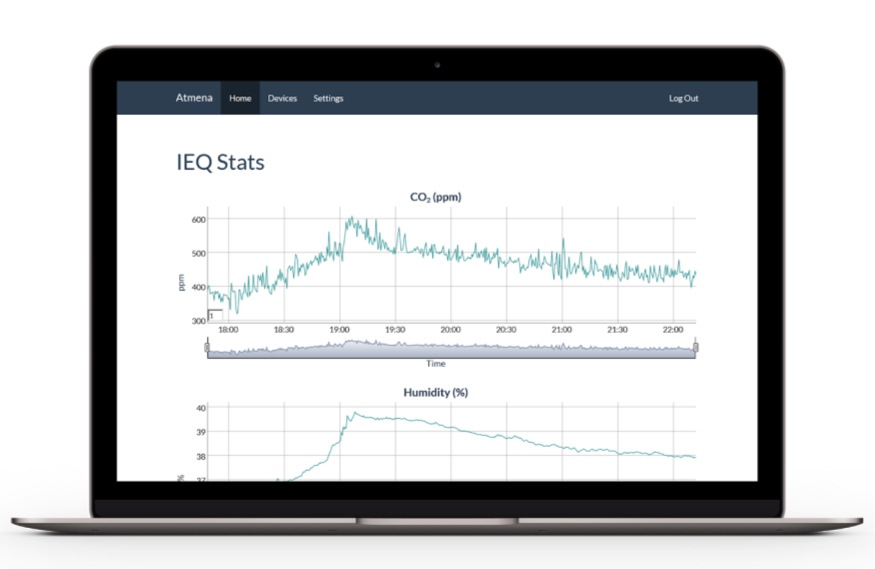
Web app
We put together a bare bones web app using react to host the converted sensor data. You can checkout the web app repo for more details. As the first analytics feature for this service we made a so-called “comfort score” that was a ranking of a specific space using a logistic curve to score the comfort of each part of the indoor environment: thermal, air, sound, and lighting. If you want more information about this have a look at our presentation. The scoring system was pretty last minute and based almost entirely on existing standards.
Nathan and I presented this shortly after implementing it during some end of semester madness, we didn’t know at the time we were being filmed.
We recieved some funding from the Engineer of the Future Fund to test and deploy better hardware although due to busy schedules post-grad we never took our system to market. We did however learn an awful lot about embedded software, sensors, and tieing them together over the internet - which I am still passionate about. I’m happy to see people today starting to care more about their indoor environment in meaninful ways.